Understanding material behavior under stress is crucial in engineering and materials science. The stress-strain curve is a fundamental concept that illustrates how a material responds to applied forces. This graphical representation showcases the relationship between the stress (force per unit area) applied to a material and the resulting strain (deformation). The curve unfolds unique characteristics, such as elastic and plastic regions, yielding, and ultimate strength, providing valuable insights into a material's mechanical properties. Whether designing structures, testing materials, or ensuring product reliability, delving into the intricacies of the stress-strain curve is pivotal for professionals across various disciplines.
Navigating the Stress-Strain Curve
What is a Stress-Strain Curve?
A stress-strain curve is a graphical representation illustrating the relationship between the applied stress and the resulting strain in a material. This curve is a fundamental tool in materials science and engineering, providing valuable insights into a material's mechanical properties. Typically obtained through tensile testing, the curve showcases distinct regions, such as elastic and plastic deformation, yielding, and ultimate strength. By analyzing this curve, engineers and scientists gain a comprehensive understanding of how a material responds to external forces, aiding in the design, testing, and optimization of various structures and products.
How is the Stress vs Strain Curve Measured?
The stress-strain curve is typically measured through a process called tensile testing. Here's an overview of the steps involved:
1. Specimen Preparation: A sample of the material, usually in the form of a cylindrical or prismatic shape, is prepared with standardized dimensions. The specimen's dimensions are carefully measured to ensure accurate results.
2. Mounting the Specimen: The specimen is mounted onto the testing machine, commonly known as a universal testing machine.
3. Application of Load (Stress): The machine applies a gradually increasing tensile (pulling) force to the specimen. The applied force is divided by the original cross-sectional area of the specimen to determine the stress (force per unit area).
4. Measurement of Deformation (Strain): Simultaneously, the machine measures the resulting deformation or elongation of the specimen. The strain is calculated by dividing the change in length by the original length of the specimen.
5. Data Recording: The stress and strain values are recorded continuously during the test.
Engineering vs True Stress and Strain:
Engineering stress and strain, as well as true stress and strain, are two different ways of measuring and representing the deformation of materials under load. Here's a brief comparison between engineering and true stress and strain:
1. Engineering Stress and Strain:
- Stress (σ): Calculated as the applied force divided by the original cross-sectional area of the specimen. 0σ=A0F
- Strain (ε): Calculated as the change in length divided by the original length of the specimen. 0ϵ=L0ΔL
- Engineering stress and strain are based on the original dimensions of the specimen and do not account for the changes in the material's cross-sectional area and length during deformation.
- Commonly used for simplicity and convenience in engineering applications
2. True Stress and Strain:
- True Stress (σ_true): Calculated as the applied force divided by the instantaneous cross-sectional area of the specimen. σtrue=AF
- True Strain (ε_true): Calculated as the natural logarithm of the ratio of the instantaneous length to the original length. true=ln(0)ϵtrue=ln(L0L)
- True stress and strain consider the changing dimensions of the specimen throughout deformation and provide a more accurate representation, especially in situations of significant plastic deformation.
- Often used in material testing and analysis where precise measurements of stress and strain are crucial.
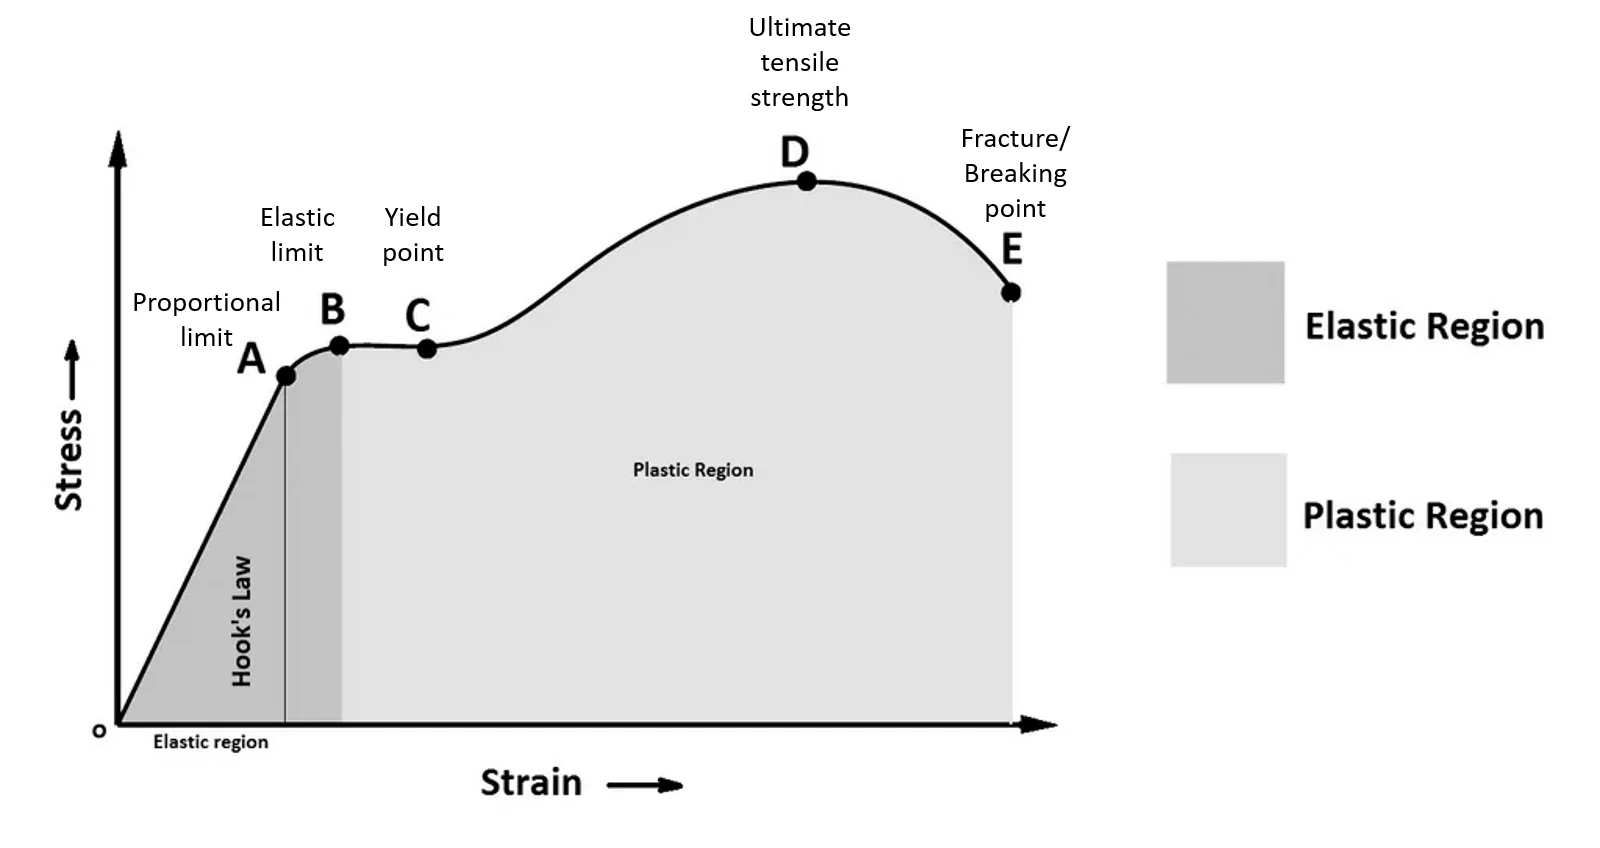
Stages of a Stress-Strain Curve:
The stress-strain curve typically exhibits several distinct stages, each representing different phases of material behavior under increasing applied stress. Here are the primary stages of a typical stress-strain curve:
1. Elastic Region:
- Description: In this initial stage, the material deforms elastically in response to applied stress.
- Behavior: The deformation is reversible, and the material returns to its original shape when the stress is removed.
- Characteristic Features: Linear relationship between stress and strain, and the slope of the curve represents the material's elastic modulus.
2. Yield Point:
- Description: The yield point marks the transition from elastic to plastic deformation.
- Behavior: Plastic deformation becomes evident, and the material undergoes permanent changes in shape.
- Characteristic Features: The stress at which yielding occurs is known as the yield strength. In some materials, this is not a distinct point but a range.
3. Plastic Deformation:
- Description: Once past the yield point, the material undergoes significant plastic deformation without a proportional increase in stress.
- Behavior: The material deforms plastically until reaching the ultimate tensile strength.
- Characteristic Features: Plastic strain accumulates, and the material may exhibit necking (localized reduction in cross-sectional area).
4. Ultimate Tensile Strength (UTS):
- Description: The UTS is the maximum stress that the material can withstand.
- Behavior: At this stage, the material may experience localized necking and thinning.
- Characteristic Features: The peak of the stress-strain curve, and the material are at their maximum strength.
Stress vs Strain Curves for Different Materials:
Different materials exhibit diverse stress-strain curves due to variations in their mechanical properties. Here's a general overview of how stress-strain curves may differ for three common materials: ductile metals, brittle materials, and polymers.
1. Ductile Metals (e.g., Steel):
- Elastic Region: Ductile metals typically have a well-defined linear elastic region, reflecting their ability to deform reversibly under stress.
- Yield Point: A noticeable yield point marks the onset of plastic deformation.
- Plastic Deformation: The stress-strain curve exhibits a significant plastic deformation region after the yield point.
- Ultimate Tensile Strength (UTS): Ductile metals reach a distinct peak stress before necking occurs.
- Necking and Failure: Necking is followed by a reduction in stress, leading to eventual fracture.
2. Brittle Materials (e.g., Ceramics):
- Elastic Region: Brittle materials also have a linear elastic region.
- Yield Point: Brittle materials lack a well-defined yield point, and they exhibit little to no plastic deformation.
- Catastrophic Failure: Stress increases until the material suddenly fractures with minimal plastic deformation.
3. Polymers (e.g., Plastics):
- Elastic Region: Polymers often have a more gradual and less distinct elastic region compared to metals.
- Yield Point: Some polymers may exhibit yield points, while others deform more continuously.
- Plastic Deformation: The stress-strain curve may show a more gradual increase in stress with significant plastic deformation.
- Necking and Failure: Necking is less pronounced in polymers, and failure occurs more gradually.
Download Physic Notes
CBSE Class 11th Downloadable Resources:
| 1. CBSE Class 11th Topic Wise Summary | View Page / Download |
| 2. CBSE Class 11th NCERT Books | View Page / Download |
| 3. CBSE Class 11th NCERT Solutions | View Page / Download |
| 4. CBSE Class 11th Exemplar | View Page / Download |
| 5. CBSE Class 11th Previous Year Papers | View Page / Download |
| 6. CBSE Class 11th Sample Papers | View Page / Download |
| 7. CBSE Class 11th Question Bank | View Page / Download |
| 8. CBSE Class 11th Topic Wise Revision Notes | View Page / Download |
| 9. CBSE Class 11th Last Minutes Preparation Resources | View Page / Download |
| 10. CBSE Class 11th Best Reference Books | View Page / Download |
| 11. CBSE Class 11th Formula Booklet | View Page / Download |
Being in CBSE class 11th and considering the board examinations you must be needing resources to excel in your examinations. At TestprepKart we take great pride in providing CBSE class 11th all study resources in downloadable form for you to keep you going.
Below is the list of all CBSE class 11th Downloads available on TestprepKart for both Indian and NRI students preparing for CBSE class 11th in UAE, Oman, Qatar, Kuwait & Bahrain.
SAMPLE PRACTICE QUESTIONS OF SIGNIFICANT FIGURES :
Q1. What is a stress-strain curve?
Answer: A stress-strain curve is a graphical representation illustrating how a material responds to applied forces. It shows the relationship between stress (force per unit area) and strain (deformation) during mechanical testing.
Q2. How is a stress-strain curve obtained?
Answer: A stress-strain curve is typically obtained through tensile testing, where a sample of the material is subjected to an increasing tensile (pulling) force, and both the applied force and resulting deformation are measured.
Q3. What does the elastic region represent on the stress-strain curve?
Answer: The elastic region represents reversible deformation. In this phase, the material returns to its original shape when the applied stress is removed. The slope of this region is the elastic modulus.
Q4. What is the significance of the yield point?
Answer: The yield point marks the transition from elastic to plastic deformation. It is the stress at which the material begins to undergo permanent deformation.
Q5. How do ductile and brittle materials differ on a stress-strain curve?
Answer: Ductile materials, like metals, show distinct plastic deformation after the yield point, while brittle materials, like ceramics, exhibit little to no plastic deformation and fail abruptly.
| Class 11th CBSE Physics Chapters |
| Chapter1: UNITS AND MEASUREMENTS |
| Chapter2: MOTION IN A STRAIGHT LINE |
| Chapter3: MOTION IN A PLANE |
| Chapter4: LAWS OF MOTION |
| Chapter5: WORK, ENERGY AND POWER |
| Chapter6: SYSTEM OF PARTICLES AND ROTATIONAL MOTION |
| Chapter7: GRAVITATION |
| Chapter8: MECHANICAL PROPERTIES OF SOLIDS |
| Chapter9: MECHANICAL PROPERTIES OF FLUIDS |
| Chapter10: THERMAL PROPERTIES OF MATTER |
| Chapter12: KINETIC THEORY |
| Chapter13: OSCILLATIONS |
| Chapter14: WAVES |
| Class 11th CBSE Chemistry Chapters |
| Chapter1: SOME BASIC CONCEPTS OF CHEMISTRY |
| Chapter2: STRUCTURE OF ATOMS |
| Chapter3: CLASSIFICATION OF ELEMENTS AND PERIODICITY IN PROPERTIES |
| Chapter4: CHEMICAL BONDING AND MOLECULAR STRUCTURE |
| Chapter5: THERMODYNAMICS |
| Chapter6: EQUILIBRIUM |
| Chapter7: REDOX REACTIONS |
| Chapter8: ORGANIC CHEMISTRY – SOME BASIC PRINCIPLE AND TECHNIQUES |
| Chapter9: Hydrocarbons HYDROCARBONS |
| Class 11th CBSE Mathematics chapter |
| Chapter1: SETS |
| Chapter2: RELATIONS AND FUNCTIONS |
| Chapter3: TRIGONOMETRIC FUNCTIONS |
| Chapter4: COMPLEX NUMBER AND QUADRATIC EQUATIONS |
| Chapter5: LINEAR INEQUALITIES |
| Chapter6: PERMUTATIONS AND COMBINATIONS |
| Chapter7: BINOMIAL THEOREM |
| Chapter8: SEQUENCES AND SERIES |
| Chapter9: STRAIGHT LINES |
| Chapter10: CONIC SECTIONS |
| Chapter11: INTRODUCTION TO THREE-DIMENSIONAL GEOMETRY |
| Chapter12: LIMITS AND DERIVATIVES |
| Chapter13: STATISTICS |
| Chapter14: PROBABILITY |
| Class 8 Link soon |
| Class 9 Link soon |
| Class 10 Link soon |
| Class 12 Link soon |
Leave a Reply